Public transit offers both a relatively low GHG-to-passenger ratio and affordable options for local travel in comparison to personal vehicle travel, thusly presenting as a key area for making progress toward climate change mitigation and social justice. Working with stakeholders in the Greater Victoria Area, this project identifies, maps, and examines three different new regional transit network scenarios, which respectively align with objectives around (1) climate change mitigation, (2) social justice, and (3) climate justice. Key outcomes of the project include an analytical framework, toolset, and process for analyzing and remapping transit networks in ways that align with climate and social justice objectives.
The project has been completed, and a report on the research activities and outcomes can be accessed by clicking the button below:
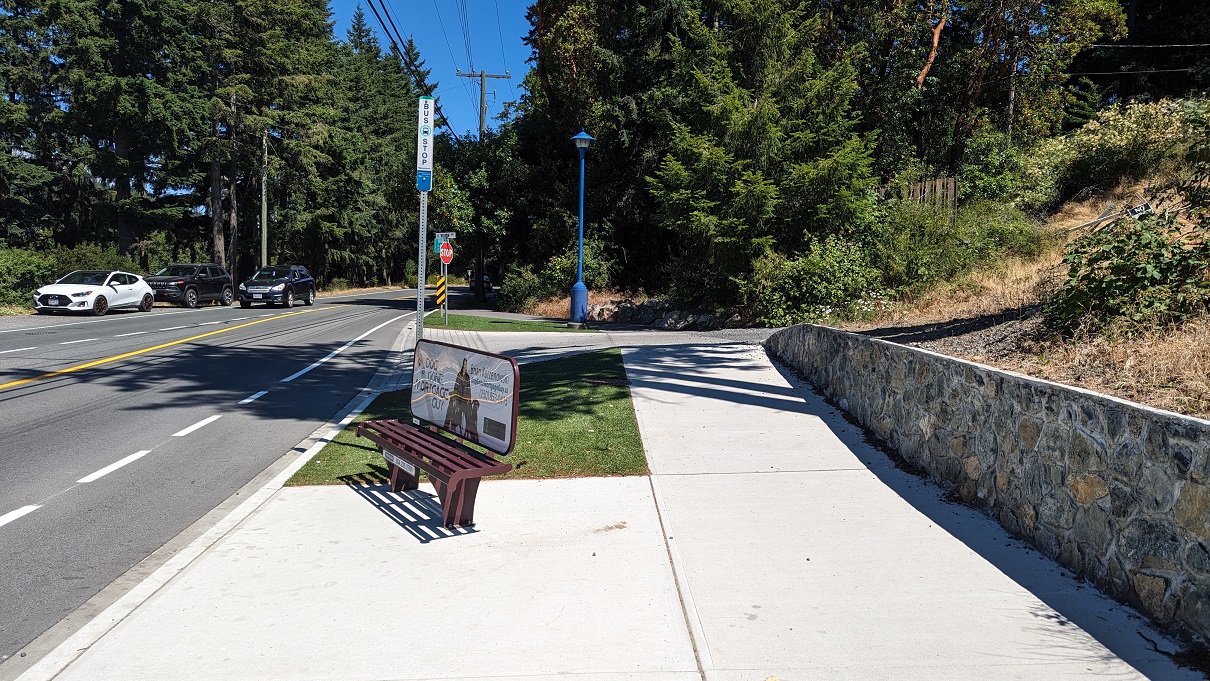
Bus stop in Langford, British Columbia
Below is the indicator framwork for (re)mapping public transit networks in accordance with climate change mitigation, social justice, and climate justice objectives. The table features the revised framework that was finalized following the stakeholder engagement sessions (see the project report for more details).
NOTE: In the table headings, "CMSW" refers to the climate change mitigation scenario indicator weights, "SJSW" refers to the social justice scenario indicator weights, and "CJSW" refers to the climate justice scenario indicator weights. In addition, each indictor in the Indicators column is labelled (in parentheses) with an “A”, “B”, or “C”: “A” refers to indicators that were used to develop the zoning maps; “B” refers to indicators used in the process of redesigning the transit networks; and “C” refers to indicators that merit consideration but (due to lack of data) were out of the scope of the study.
| Themes | Indicators | Notes | CMSW | SJSW | CJSW |
| 1. Transit network and diversity in travel modes | 1.1 (C) - Average trip distance | N/A | 0.70 | 0.71 | 0.70 |
| 1.2 (B) - Number of bus stations and lanes | N/A | 0.10 | 0.64 | 0.63 | |
| 1.3 (B) - Transit accessibility to car parking facilities | N/A | 0.43 | 0.50 | 0.50 | |
| 1.4 (C) - Integration of pedestrian and bike routes with public transit | N/A | 0.73 | 0.74 | 0.72 | |
| 1.5 (B) - Transit mode diversity | N/A | 0.77 | 0.77 | 0.77 | |
| 2. Accessibility improvement | 2.1 (A) - Accessibility for elderly groups | The percentage of elderly people in census tracts | 0.09 | 0.65 | 0.73 |
| 2.2 (A) - Accessibility for lower-income people | The percentage of people with lower than $40,000 annual income in census tracts | 0.09 | 0.74 | 0.11 | |
| 3. Reduced emissions and habitat connectivity | 3.1 (C) - Carbon emissions by public transportation | N/A | 0.66 | 0.63 | 0.58 |
| 3.2 (B) - Proximity of public transit to green spaces | Priority of designing transit routes near green spaces | 0.46 | 0.40 | 0.74 | |
| 3.3 (B) - Reduction of barrier effects | 30 km/h speed limit for routes near habitats | 0.44 | 0.35 | 0.36 | |
| 4. Population density | 4.1 (A) - Employment density | The percentage of employed people residing in the census tracts | 0.81 | 0.81 | 0.90 |
| 4.2 (A) - Population density | The population distribution among the census tracts | 0.73 | 0.61 | 0.71 | |
| 5. Satisfaction in services | 5.1 (B) - Public transit affordability | N/A | 0.83 | 0.91 | 0.94 |
| 5.2 (B) - Bus wait time | N/A | 0.83 | 0.91 | 0.94 | |
| 6. Integrated land-use and transportation planning | 6.1 (A) - Accessibility provision to recreation and entertainment amenities | Land-uses and build structures that accommodate recreational activities | 0.70 | 0.61 | 0.67 |
| 6.2 (A) - Accessibility to and connectivity among areas with different land-uses | The climate change mitigation scenario includes institutional, commercial, recreational, and mixed-use land-uses; the social justice includes the aforementioned land-uses and also includes charitable services (e.g., food banks and shelters); the climate justice scenario is the same as the social justice scenario | 0.73 | 0.73 | 0.81 |
Below are the scenario models used to develop and examine the three different transit network options for the Greater Victoria Area. The models were created using Model Builder in ArcGIS. Click the thumbnail images to expand and explore the different scenario models.
Social Justice |
Climate Mitigation |
Climate Justice |
Click the button below to download the data used to examine the transit system and remap/redesign it in accordance with the climate change mitigation, social justice, and climate justice scenarios.
Download Data for ArcGIS Download Data for Google Earth
Below are the scenario maps produced through this analysis. Directly below is an interactive map that allows users to toggle suggested new and changes to bus routes as per the climate change mitigation and social justice indicators and analysis. Further below are a series of image files that dislay scenario and data maps for the climate change mitigation, social justice, and climate justice scenarios.
Social justice scenario maps and data can be seen by clicking the images below.
Recommended Network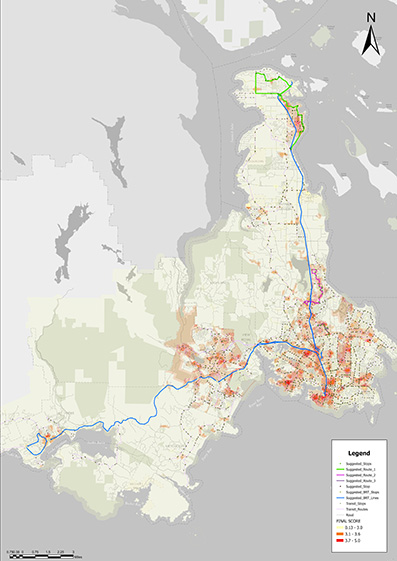 |
Low/No Access Areas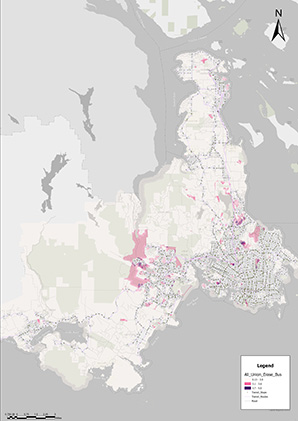 |
Zoning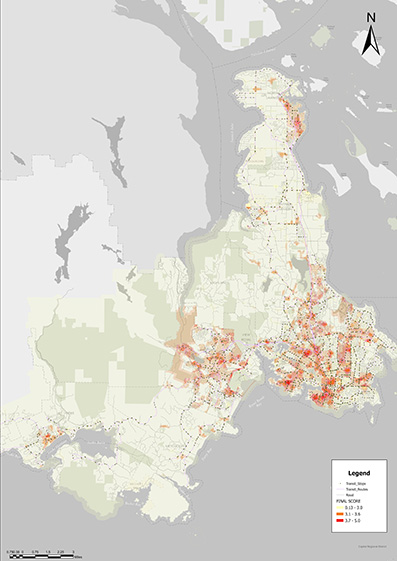 |
Transit Access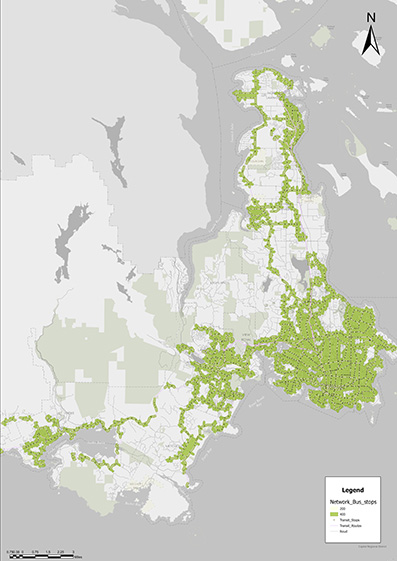 |
Climate mitigation scenario maps and data can be seen by clicking the images below.
Recommended Network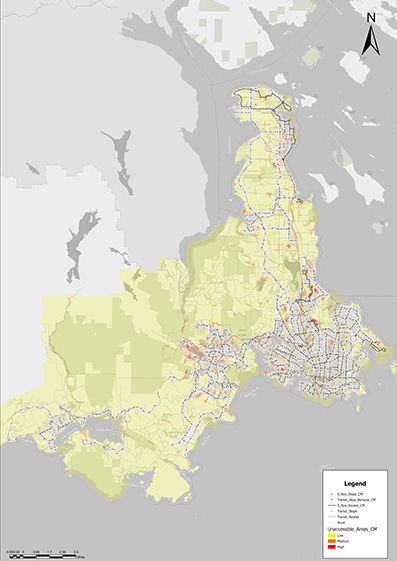 |
Low/No Access Areas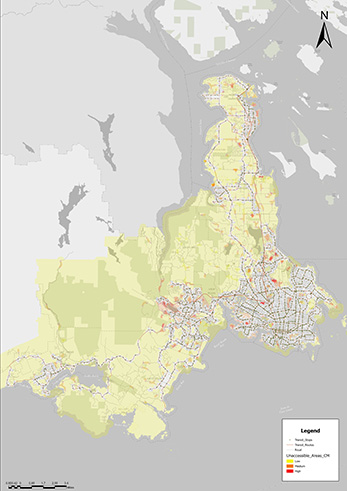 |
Zoning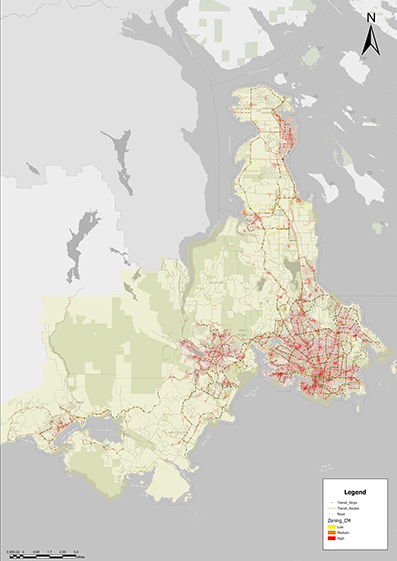 |
Climate justice scenario maps and data can be seen by clicking the images below.
Recommended Network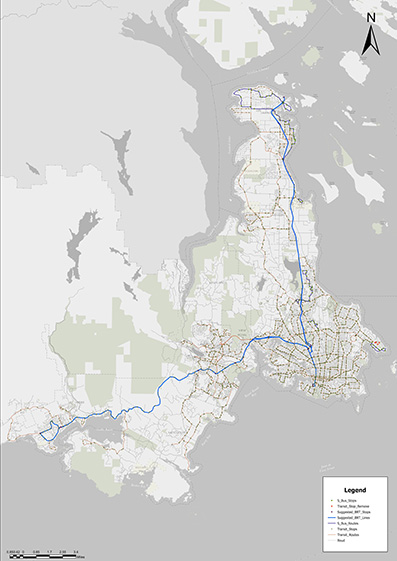 |
Low/No Access Areas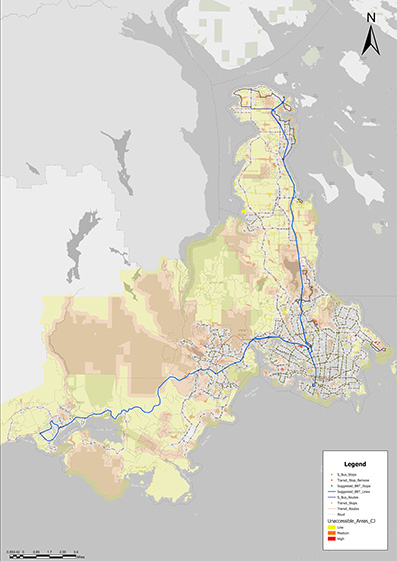 |
Zoning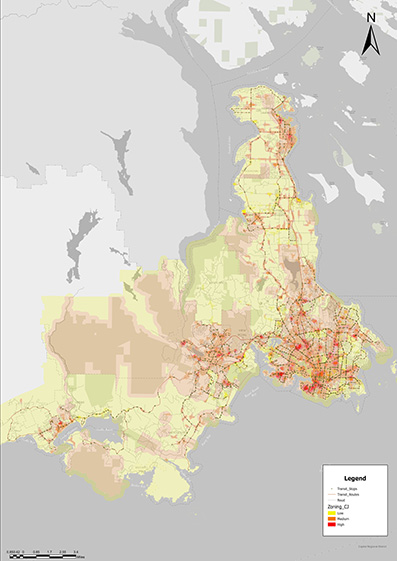 |
Recommended transit routes and bus stops based on the analyses can be seen in image below, and the image can be expanded by clicking on it.
Recommend Transit Network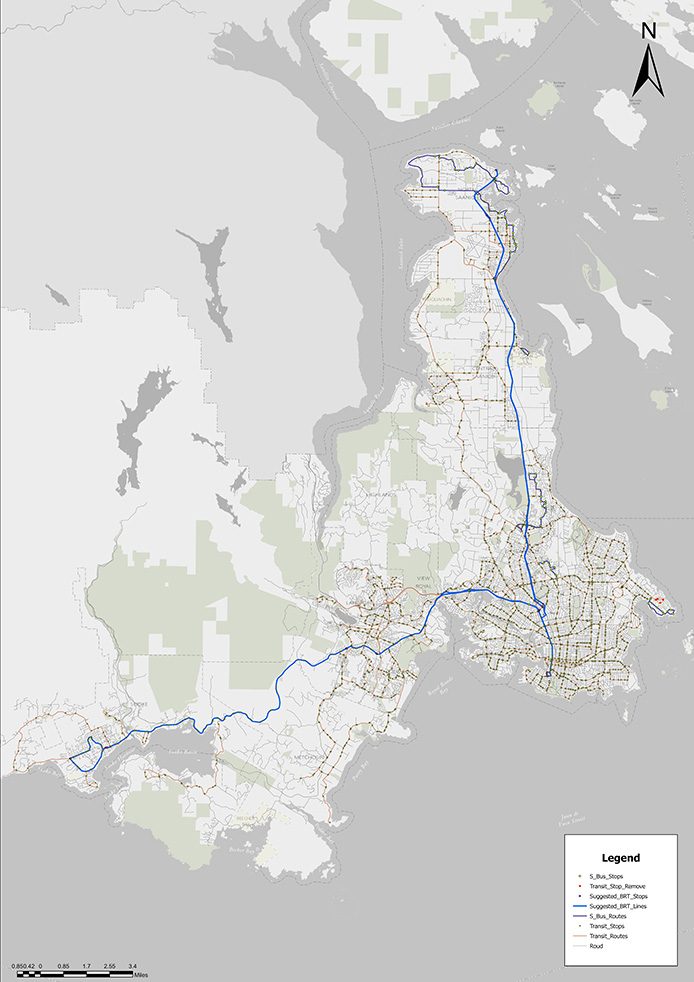 |
 |
This project is being supported by funding from the MITACS Accelerate program.

